Summer Project 1 - Citibike Data

So, the Citibike program has been running for a bit. I like the idea, but I have some reservations -- it's great for getting around in the zone - I've been using it for short shopping trips - run cross town to Fairway or take a quick trip from work to Porto Rico Importers or Rocco's Pastries. On the other hand, the zone doesn't get to the residential neighborhoods of upper Manhattan or the boroughs and the price per day is way too expensive for regular working class joes, particularly on top of a subway trip.

In any event, I was curious about station use patterns. Cool thing is that you can get live data from here. This was a great opportunity to play with some tools to see if I want to use them in class next year. In particular, backbone.js and d3.js.

So, I'm grabbing the station data every 5 minutes, storing it in a Mongo database, and threw together a little map and graph app:

You can check it out here.

The code is up on GitHub: citibike-1.

I might play around and add more graphs as I collect more data or maybe I'll just move on to the next project.

NYTM + StuyCS

For those of that don't know, the New York Tech Meetup it's one of the things that help make the New York Tech Scene so awesome.

It's a group of some 30k+ members and once a month, at Skriball Center at NYU they hold a meetup. It's really quite an event. Members of the tech community demo their projects, there's question and answer time, and afterwards theres a gathering for schmoozing amongst the crowd and the presenters.

During the QA period, there's one rule -- You can't ask "What's your business model." I think we all love that it's about the tech not about the buck.

Stuy CS family members such as Digital Ocean, Tactonic Technologies, and Vantageous have all presented. I'm not able to go to the meetup regularly - It's usually on a school night and tickets are hard to come by, but I love the fact that whenever I'm there, I reconnect with old Stuy CS family members and meet new ones. Yesterday, at the meetup I met Ron Williams, of Knodes. He's Stuy '94 - one year before my first CS grads.

So, why am I writing about NYTM? As a result of our Demo Night, Brandon Diamond invited a couple of the groups to present as part of the Hack of the Month segment.

Brian, Eli, Jules, and Shan got up on stage and presented their work to a live audience of about 1000 technologiest plus those viewing the simulcast.

Afterwards the we mixed with the crowd. A great experience for the guys.

As Brandon said afterwards - "That's another 1000 people that know what you guys are doing." Given the difficulties in getting our program recognized and to more students, this exposure is so important.

So, thanks Brandon, Jessica, and everone else involved in giving the kids this opportunity.

UPDATE: If you want to actually see the kids, check out the vide here: NYTM Video. Just go to the 4th yellow dot (about 52 minutes in).

Gender stats

People keep asking me about how we're doing with respect to gender balance and CS education at Stuy.

Rather than writing the same email again and again, I figured I'd summarize things here.

We've done rather well at Stuy. I might write more in depth at some point in the future but we don't dumb anything down and we aren't patronizing. I think much of the success can be attributed to:

  • Awesome teachers that really know their CS and are great teachers.
  • Teachers that buy into the same insanity.
  • Well designed courses in a well designed sequence.
  • A well designed required intro course where young ladies can see that this stuff is cool and women are just as good at it as men.
  • Did I mention awesome teachers.
  • An atmosphere where everyone feels accepted.

An important fact to consider here is that Stuyvesant is only 40% female so our numbers are actually even better than they appear. Also, we've typically offered AP CS to 150 students and our senior classes to between 60 and 120 students. Even with these numbers, we're always over subscribed (it's not uncommon to have 300 - 400 students out of a class of about 800 students request AP Computer Science).

Course Percent Female Notes
C Physics (National) 23% and 26% There are 2 actual exams (E and M, and Mechanics) hence the two numbers
C Physics (Stuy) 18%
  • We don't have the breakdown between two exams.
  • Note that all Stuy students take the required regents physics class prior to being allowed to sign up for Physics C
AP CS (National) 14% - 18.92% 18.92% is current, the 14% reflects when both the A and the more rigorous AB exams were offered
AP CS (Stuy) 25%
  • Stuy teaches a superset of the old AB curriculum.
  • This actully represents a down year.
  • Normally we hover around 30%.
  • All stuy students take a required intro course prior to being allowed to sign up for AP CS.
Systems / Graphics 21% This one option for students that complete APCS
Software Development 37% The other post-AP option
Senior classes combined 29%  

You might wonder why I included the C Physics numbers. Of all the other STEM AP classes, C Physics is probably the most analagous to AP Comp Sci.

  • Both are electives that are traditionally male dominated.
  • Both follow a required class in an earlier grade.
  • Neither is a graduation requirement,
  • but C Physics can fulfill one of Stuyvesant's senior science elective requirements.

I didn't look at Calculus because at Stuy, Calc is just "the next math course" so just students take it regardless of gender.

Another difference is that AP CS is offered mostly to juniors and that the students have additional classes they can take in their senior year.

Notice that Stuy CS outperforms the national gender breakdown while Stuy C Physics doesn't. The point is that it's not a Stuy thing, it's something we're doing in our little CS corner of the world.

Another interesting morsel is that we recently had our demo night. There were 13 combined students on the four winning teams. 6 were young ladies so women were in no way dominated in our most advanced class.

So, there you have it. What's going on with gender and CS at Stuy.

Graduation

One week ago today was Stuyvesant's graduation.

I usually know a number of seniors pretty well but, since I like to cycle through classes, every couple of years I have a group that I've been with from 10th grade to 12th.

This was one of those years

It was extra special because it was also my daughter Batya's graduating class.

It's been an amazing gift to be able to work at her school for the past four years and she's been amazingly tolerant. Particularly with both her and her boyfriend in my class this year.

Actually, they're both terrific and I think I only embarrassed her a couple of times.

Every few years, my seniors ask me if I want them to nominate me as faculty speaker at graduation. Usually I say no - stage fright. This year, Batya asked. I thought it would be really cool. I said yes and the troops came through and voted me in. I wasn't sure I would be the winner, but as Peter commented "but you lead the most popular cult at Stuy!" It would have been enough of an honor to speak to the graduating class, including many students that I feel connected to and it would have been a great honor to speak at Batya's graduation. To add to it all, the guest keynote speaker was my dear childhood friend Ben Fried.

Truly a career highlight.

Ben was terrific. I was watching the audience as he spoke - he delivered a great message and really kept the classes attention. No video as of yet, but Ben published the text on Google+.

You can find it here

Here's a video of my speech. Jennifer said some very nice things to introduce me. I was tempted to go off script right at the beginning and point out that many of the nice things she said were really about our CS team and not just me:

I really didn't read the speech, just used the printed text as notes, but here's what I worked from: gradspeech.pdf

The graduating class seemed to enjoy it, at least as much as one can enjoy any graduation speech, but, for me, as I said, a career highlight.

Demo Night

This past year, I was able to convince my administration to allow me to create a new course - Software Development. I really felt there was something missing in our kids CS preparation - missing both from Stuy's program and from many youngsters college experiences.

I plan to do a few posts on the course, it's design, implementation, and lessons learned, but for today, let's look at the years culminating event:

The class had students working in teams taking projects from idea to completion. Last week, we had a demo night, hosted by CSTUY and Google. Neal Zupancic, part of our Stuy CS family attended the event and put together a wonderful write up on the CSTUY Blog.

Before getting into details, thanks goes out to Ben Fried, Mike Mu, and the rest of the Stuy CS Googlers who helped out. Ben for securing the space, Mike for coordinating everything, and the rest for manning the event.

The students, parents, friends, alums, and guests from the NY Tech scene gathered at Google at 6:00 last Thursday. Judging the event, we had Brandon Diamond of HuffPost labs, founder of the Hacker Union and NYTM board member, Evan Korth, founder of hackNY, NYTM board member and NYU Professor and Lee Fischman, StuyCS family member, currently at Galorath, and as dinosaurs like me remember, one of the creators of The Big Electric Cat. Awesome folk all.

The students presented a set of amazing projects. They can all be found on the class github page.

The evening was like a NYTM for a group of amazing high school youngsters.

Here are some of the highlights:

Scavenger Tours
Tied for winning project

Create tours that people can take using their mobile devices.

Stuy Wiggles
Winner - "Scratch your own itch"

An attempt at fixing all the problems students have registering for classes at Stuyvesant. This is probably the most polished project of all the demos.

Stall Wall
Winner -- most amusing project

Collaborative network writing on the bathroom wall!!!!

Web Explorer
Tied for winning project

Turn any web page into a game.

The students had a great time and got lots of feedback from the audience, particularly during pizza time after the demos.

I'll post more about the course in the coming weeks but demo night was a terrific conclusion to a terrific first year.

Real Data - Part II

About a month ago, I talked about using real data with our intro classes. After looking at the correlation between school's SAT scores and free and reduced lunch rates, it was time to turn the students loose.

The assignment: Find some interesting data out and do something with it. Make a web page that shows what you did and what you discoverde. We had already looked at the NYC Data Mine as well as a few other sources but students were encouraged to find new data sourcess.

The results were terrific. On top of the requirements, some students figured out how to incorporate Google Maps, graphs, and other niceties well beyond what we've covered in class.

Explorations included:

and even

That's just a sampling.

Well done guys.

Evaluating Teachers - Evaluating schools

The Problem:

The buzz word is "accountability." Why are teachers special? Why don't they feel they need to be evaluated like other professionals? Why do they feel they need a "job for life?"

Of course, the job for life line is nonsense -- teachers have tenure, but that's just due process - not a guarantee of a job.

Friends in the private sector ask "if a teacher is doing a good job, why do they need tenure? In the private sector as long as you're producing, you've got nothing to worry about."

Well, first I dispute that last sentence. second, K-12 education isn't the real world. It's rife with stories of administrators that go after teachers for no apparent reason. Why? Because accountability doesn't mean accountability - it means we can fire teachers at will. No one wants accountability to apply to anyone except the ground troops. I don't have an exact attribution, but Mayor Bloomberg is frequently quoted as stating "If parent's don't like the way I run the schools, they can boo me at parades."

Beyond that, the powers that be state that teacher accountability revolves around flawed "value added" metrics but other bloggers such as Gary Rubintein have already done a great job debunking that.

The Solution:

The solution is to simplify. There's a better way. Let's start by making the principals accountable. Bottom line is that they're responsible for a school's success. If the school doesn't cut the mustard, then they're out. But, how do we measure this?

High Schools

Madlib Madness

Earlier in the term, our intro classes spent a little time learning some basic HTML. We don't spend a lot of time on it, just enough so that the students can present their work in a static web site. The end goal, though, was to programatically generate the web sites - there's nothing quite as empowering to a student as when they can present their work to the world.

Finally, it's all coming together.

Now that the classes are comfortable with Python, we can have some fun. We all remember Mad Libs - that wacky word game where you select unknowingly select words to substitute into a basic story and hilarity ensues.

We did our own versions using Python files, lists and dictionaries.

Here are some of the results: 1. http://homer.stuy.edu/~richard.zhan/19-Madlibs.py 2. http://homer.stuy.edu/~veronika.azzara/madlibifystory.py 3. http://homer.stuy.edu/~belinda.liang/18-MadLibsMiniProject.py 4. http://homer.stuy.edu/~kyle.oleksiuk/MadlibifyProject5.py 5. http://homer.stuy.edu/~phillip.huynh/story.py

The students wrote a basic story with substitution points. Their programs then randomly replaced these points with words from an assortment of categorized lists.

Enjoy!!!!!

Real Data

When looking for assignments for our classes, in addition to trying to craft assignments that develop and reinforce key ideas, we also strive to come up with ideas that "speak" to the students and keep their interest. We write small games, use problems within the student's experiences, and in general try to find problems that are appealing.

This is much easier to do when the kids can read data from a file. The tool we're using with our sophomores right now is Python and Python makes reading files very easy. Combining file input with basic string functions and all of a sudden, we can read and parse comma separated values.

{% highlight python linenos %} l=[] for line in open(filename).readlines(): l.append(line.strip().split(",")

True, this doesn't handle quotes and embedded commas, but that just leads to a discussion on cleaning up data and when we do list comprehensions, things get even slicker.

We could just make up some sample data, for example, student test scores:

Tom,95,87,97,93

Sarah,98,98,84,92

Harry,90,90,90,90

Sue,94,95,96,97

But it's so much more fun with the wealth of CSV data waiting to be grabbed. If your kids like sports, you can check out baseball-reference.com or it's counterparts for basketball or football.

We decided to look at government data instead.

Federal data can be found at data.gov but we focused on New York City. We settled on SAT data. SAT math, reading, and writing scores for all NYC public schools. Something Stuy kids are very interested in. We were able to look for comparable schools, which schools had large spreads between math and verbal, which schools had score increases over time, etc.

Much more interesting to look at real SAT data than made up student grade info.

Tomorrow we'll look at combining data sets -- looking at the relationship between SAT scores and school ratings and demographics. It should be interesting. Later, we'll grab books from Project Gutenberg and see how we can analyze large texts.

The moral of the story - there's lots of great data easily accessible -- let's use it to motivate and engage our students.

UPDATE:

It's taken me a while to post this, and in the meantime we analyzed the SAT data from one NYC data set and matched it with a data set of demographic data:

The graph shows a strong correlation between schools with a high number of students eligable for free lunch (the Y-axis) and low SAT scores (the X-axis). This led to a very interesting conversation on the effects of poverty.

We also noticed a couple of outliers. There's one school at about (1400,82). High poverty (free lunch) and national average SAT. Also two schools with low free lunch numbers and middling SAT scores (1400,17ish).

The (1400,82) point turns out to be a school that caters to English Language Learners and we presume has a large number of recent immigrants (partially noted by the name and also by the fact that their SAT math scores far surpassed the English ones).

Great discussions ensued all due to applying CS to real world data.

Who won the election -- Quadratic to Linear Time!!!!!

Last week was crazy. Busy, stressful, late night after late night. It ended, though, on a great note.

A young lady in my intro class found me in my office near the end of the day:

Student: Mr. Z, I wanted to make sure to catch you before vacation!

Me: What's up?

Student: I wanted to tell you that today's lesson was AWESOME!!!!!!

Wow. I've been teaching 23 years and that's never happened before!!!!

So, what was the hubbub about?

We've been doing list processing in Python over the past few days. We already did the basics, such as finding the largest element in a list:

{% highlight python linenos %} def find_max(L): maxval = L[0] i=0 while imaxval: maxval=L[i] i += 1 return maxVal

We've also done basic searching, counting elements, removing elements, etc.

Today we started with finding the mode of a list of grades.

Most students approached the problem as a maximum problem. Assume the first item is the mode and find it's frequency, then proceed through the list each time seeing if the current node occurs more fequently than the "mode so far." Pretty much the same idea as find_max (but in this case, returning a list of all the modes).

{% highlight python linenos %} def mode(L): modecount = L.count( L[0] ) modes = [ L[0] ] i = 1 while i < len(L): c = L.count(L[i]) if c > modecount: modecount = c modes = [ L[i] ] elif c==modecount and L[i] not in modes: modes.append( L[i] ) i += 1 return modes

Pretty cool. The kids are doing something pretty sophisticated here.

Time to look deeper. We started running this on larger and larger data sets. Things started really slowing down at about 20K. We then timed things to get some numbers (thanks StackOverflow).

What was going on. The students pretty quickly honed in on the line that called L.count(L[i]) -- Hidden Complexity.

We haven't done big-O notation but the class easily saw that count had to go through the entire data set and we ended up with an N^2 algorithm. For example, if we have 10 items, the main loop executes 10 times and each time, count goes through the entire list (10 items) as well. If we go to 100 items, it becomes 100x100.

What to do????

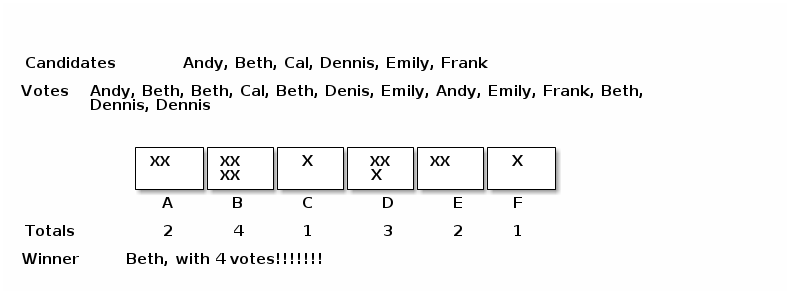
Time to talk about what's probably the most discussed instance of mode finding - elections. The winner is "the mode of the ballots."

Of course we don't use the above algorithm. We usually tally or count the ballots. We go through the ballots once, each time adding one to the appropriate candidates "bucket."

From here, it's a short step to see that we can use a list. It's indices represent the grade values and the data in the list the counts or tallies:

{% highlight python linenos %} def fastmode(L): i=0 counts = [] while i<max(L)+1: counts.append(0) i+=1 i=0 while i < len(L): counts[ L[i] ] += 1 i += 1 modecount = max(counts) modes = [] i=0 while i < len(counts): if counts[i]==modecount: modes.append(i) i=i+1 return modes

We go through the list once to build the tallies and then the "tally" list once to get the modes. Simple, straightforward, and linear time!!!!!!!!!

The original routine started to hit a roadblock at about 20K items, here we got to one million without breaking a sweat.

The take away:

  • Get it working first.
  • Then profile to find your bottleneck
  • Look at the problem in a different way
  • Using data structures in a clever way can really improve performance.


Enter your email address:

Delivered by FeedBurner

Google Analytics Alternative